Objective
The goal of this lab is to use the robot's TOF readings to create a map of a static room.
The goal of this lab is to use the robot's TOF readings to create a map of a static room.
I used the same orientation PID controller as I did in Lab 6. The robot needs to take measurements at regular intervals in a rotation. To do so, I updated my main loop so that the setpoint is incremented as soon as the robot "settles." When the robot has settled, it takes TOF measurements of its surroundings.
To compute orientation, I used the IMU's built-in DMP. However, I ran into the issue of angle wrapping: when yaw reaches +-180 degrees, it will suddenly switch to -+180 degrees. To handle this, I wrote an angle-unwrapping function and added a few lines to my get_IMU() function.
In Python, I send BLE commands to start control, stop control, set gains, set the increment, send data, etc. Like previous labs, I use a notification handler. The configuration that gave me the best results seemed to be:
Below is a video of the robot spinning slowly.
My robot drifts slightly with each turn; the maximum drift distance appears to be about 6 inches from what I can see.
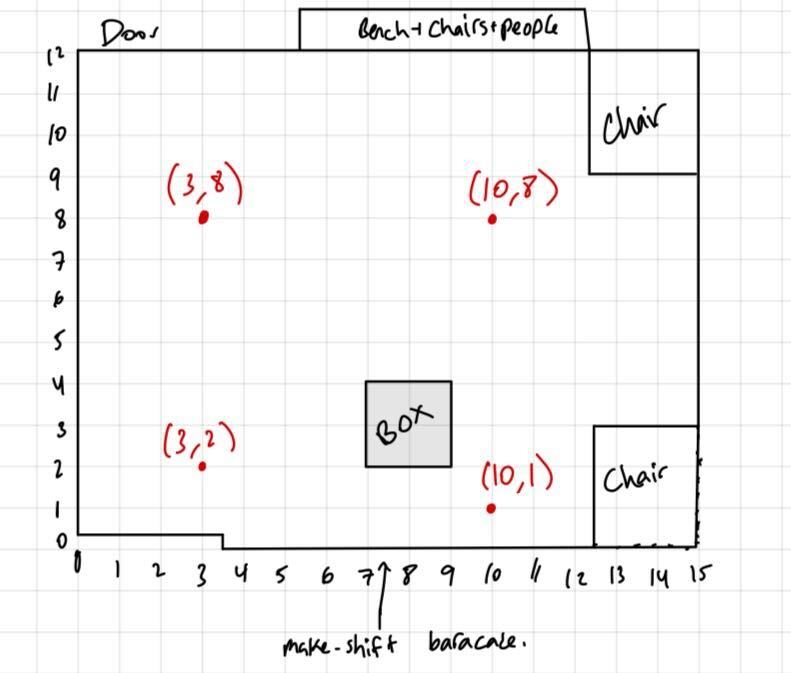
Note: it took me too long to get the robot to spin slowly. I also cooked one of the motor drivers on my own robot, so I needed to coordinate with a friend to share a robot. In lab, I was only able to get points (-3,-2) and (5,-3). To demonstrate the mapping of an entire room, my friends and I set up an obstacle course on Phillips 2nd floor.
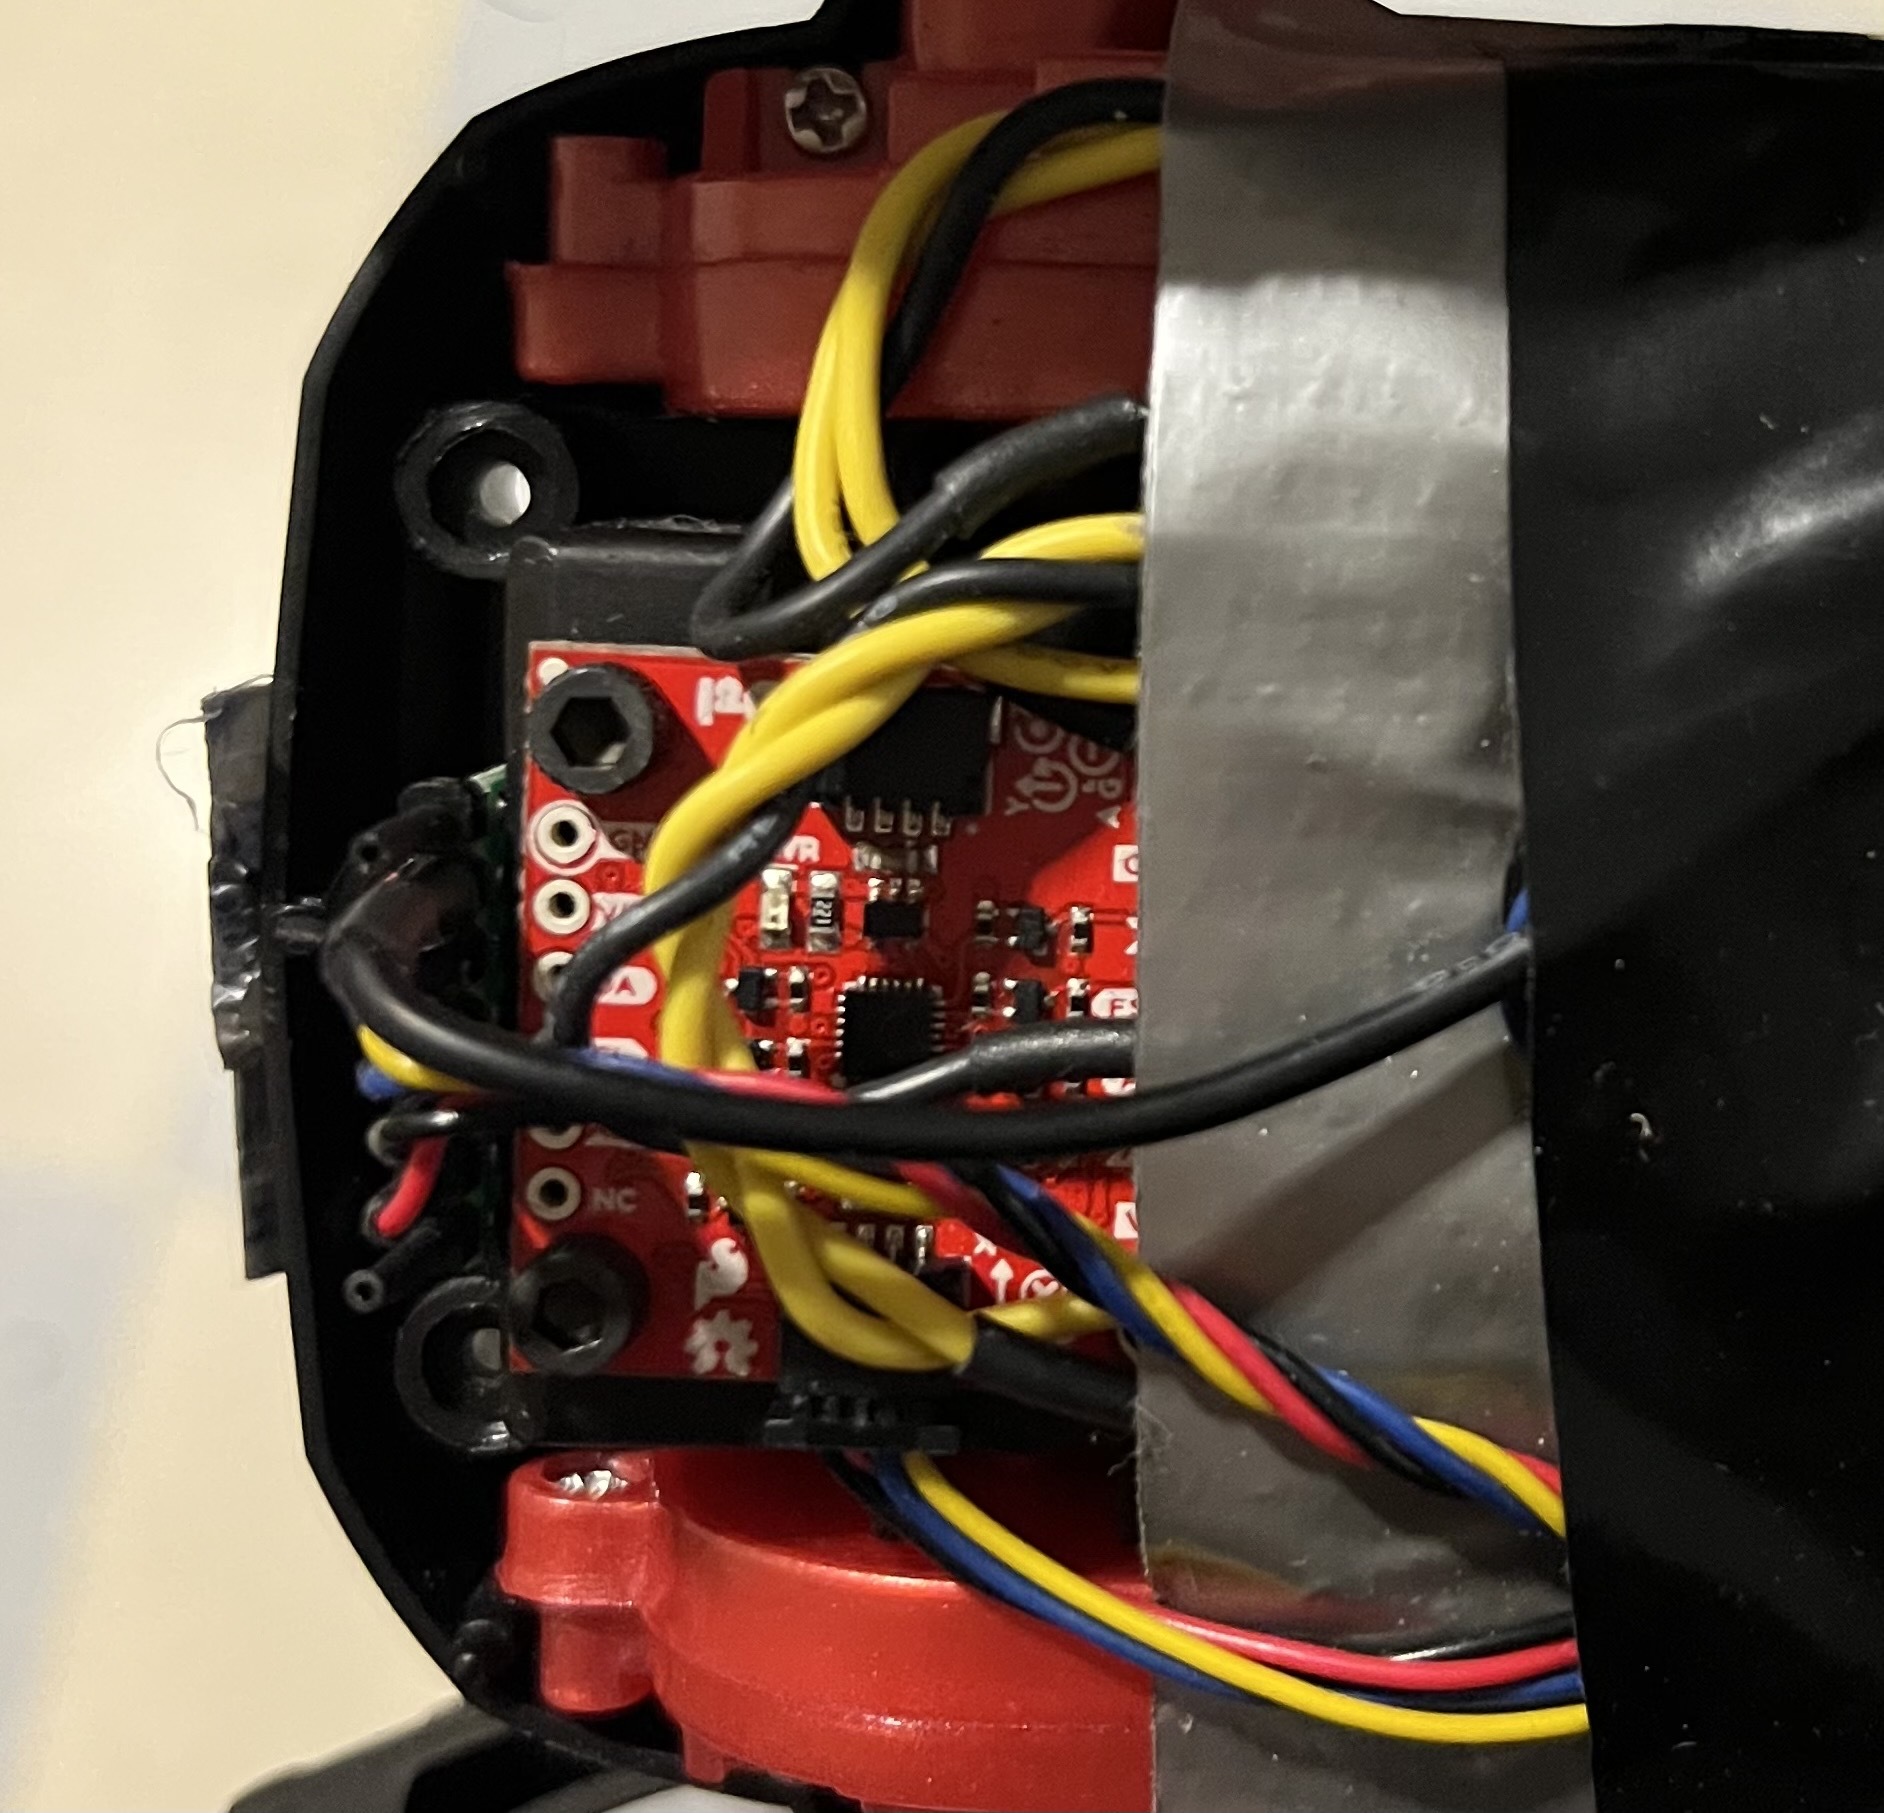
My TOF sensors were swapped, so the one that's labeled "side" is actually the one in front. Unfortunately the side sensor seemed to be broken so I did not record any data from it.
When post-processing the data, this was the procedure I followed:
This is my angle-wrapping function:
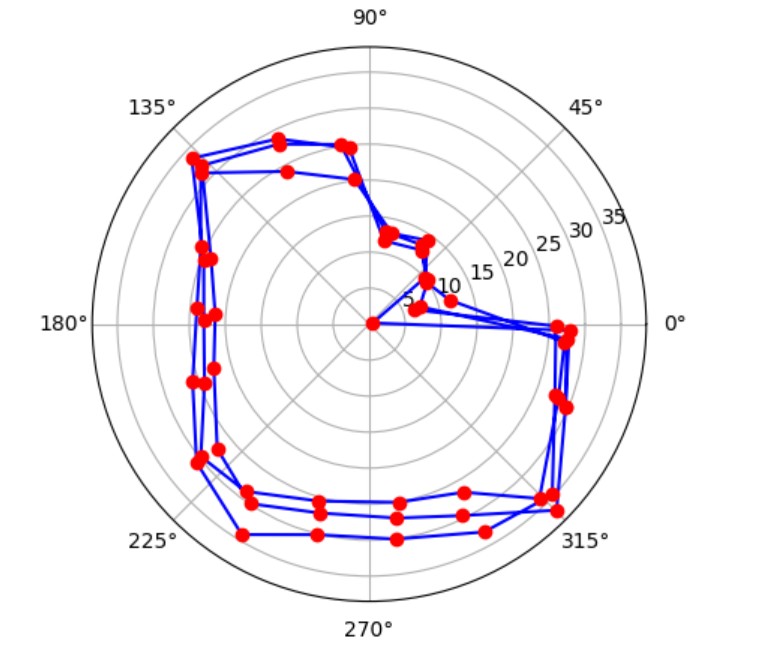
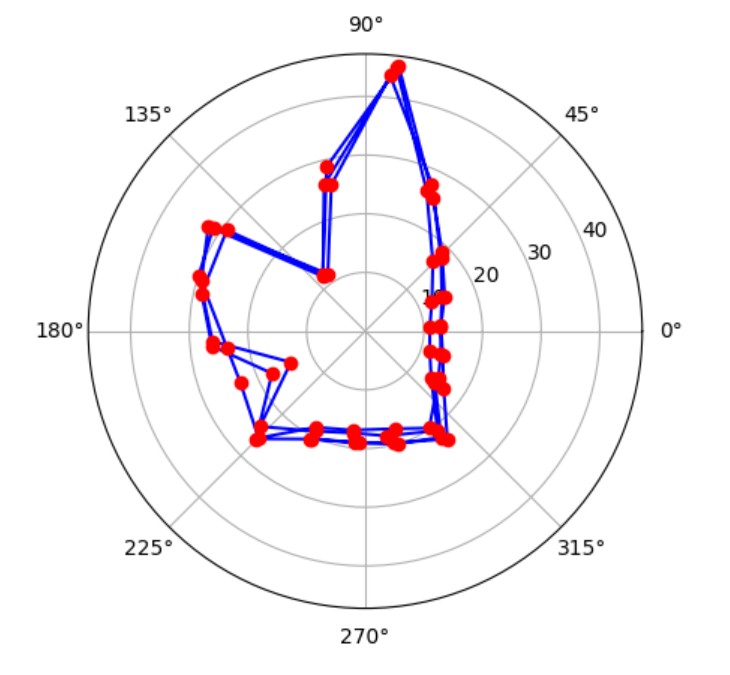
Below are the individual and combined plots from lab data:
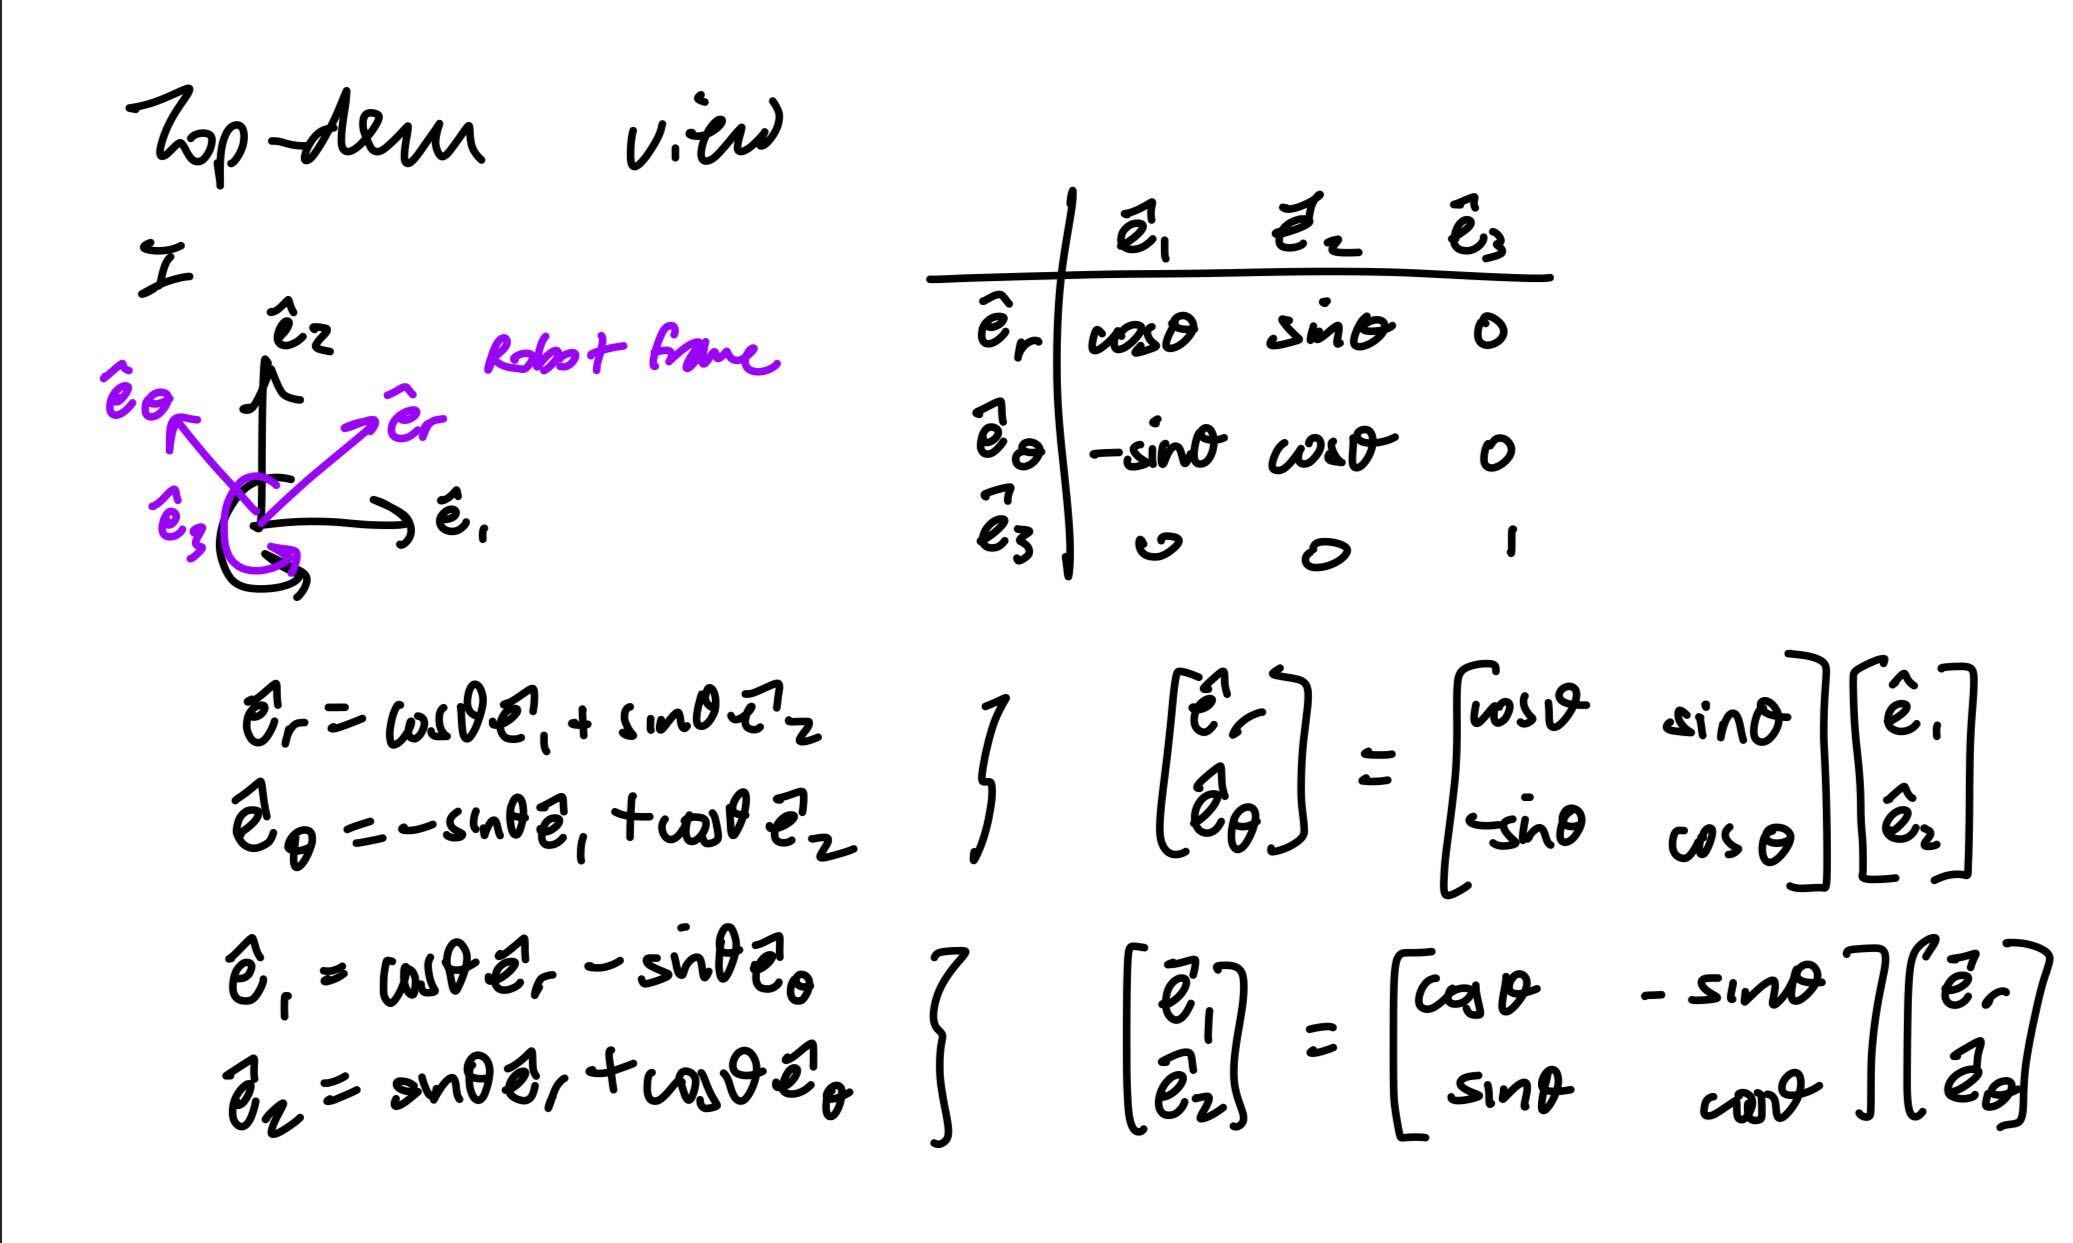
Using notation and methods I learned from MAE 2030, I computed the transformation matrices.
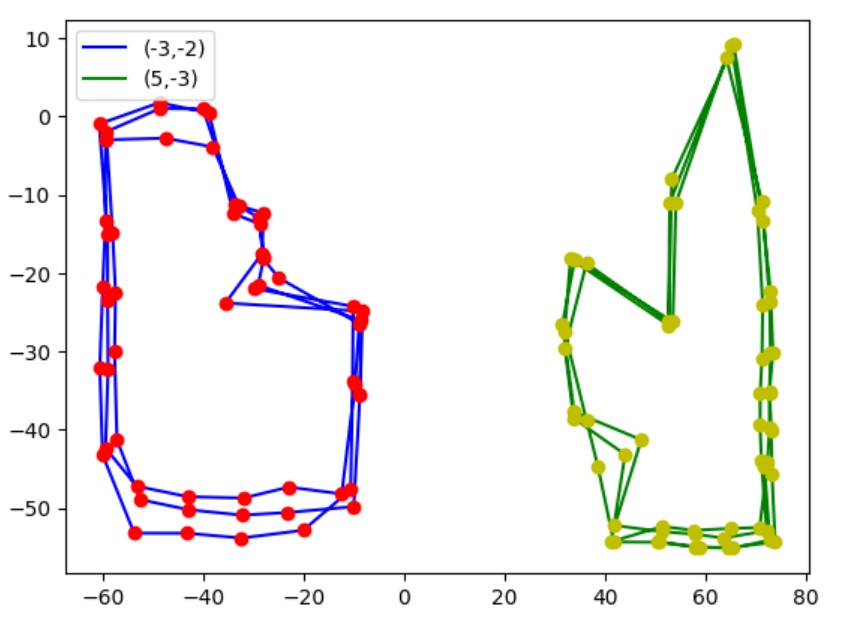
I was able to plot the following lines for the lab dataset:
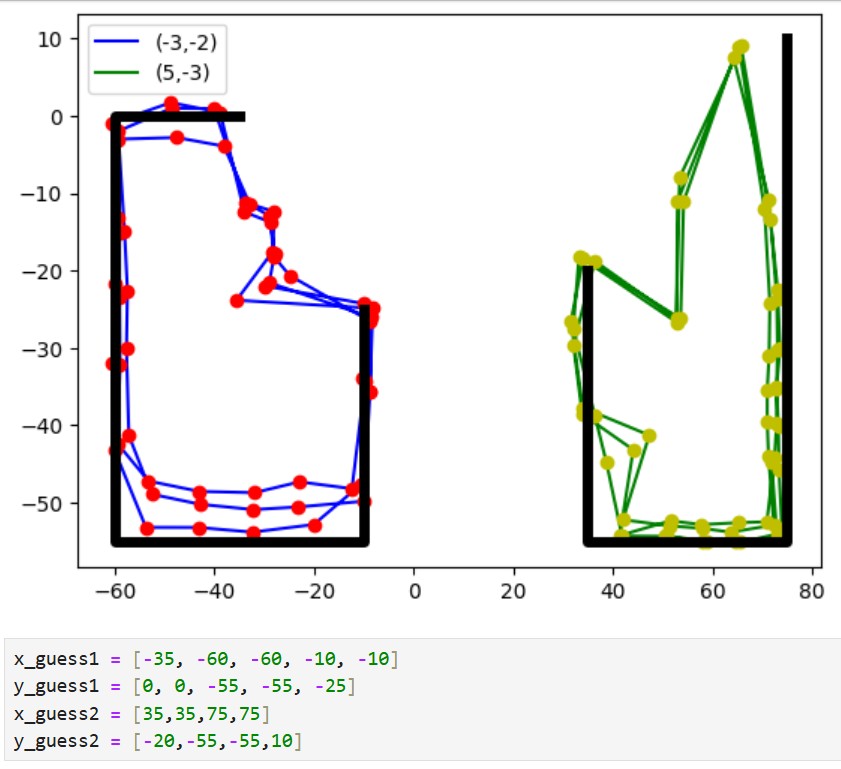
I have not corrected for any drift in the above plot. If I were to do so, I would first average the points in "clusters." From observing how the robot moved, I think my error band is around +/-3 inches, so I will start by adjusting around those numbers.
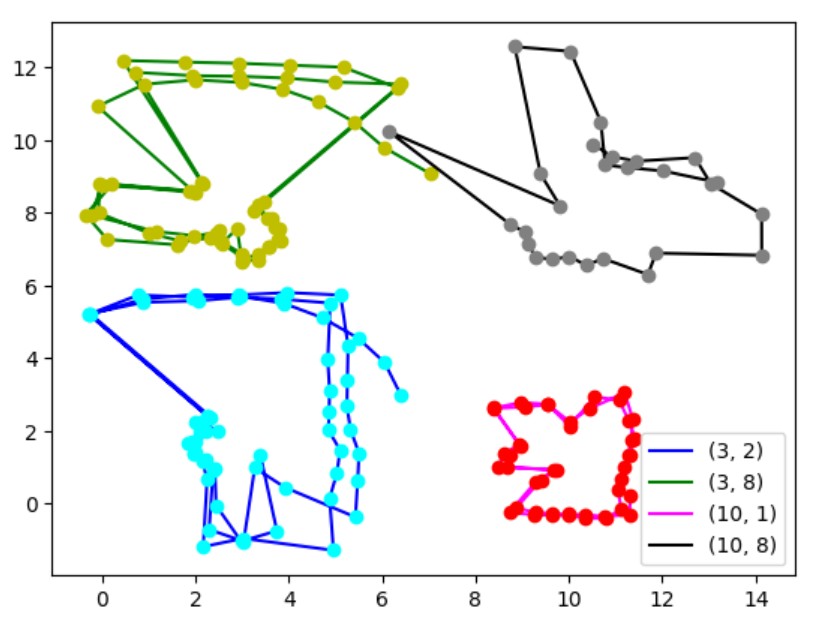
I only took data from the four "corners" of my obstacle course in Phillips. I have not included a lineplot for the obstacle course because I think I will need more data before I can make anything that is coherent. I think my dataset would've been more complete if I had taken data at an x-value in between 3 and 10 feet.
I referenced Aidan McNay's website for the angle-wrapping function. My friend Kelvin let me use his robot. My friends set up an obstacle course that I also used.